Cost of Education, Domestic, Ethics, For-Profit, Friend, Fraud, or Fishy, Graduation Rates, Infographics, Required, Universities & Colleges - Written by Wired Academic on Saturday, October 13, 2012 9:55 - 2 Comments
Infographic: Where Do the For-Profit College Dollars Go?
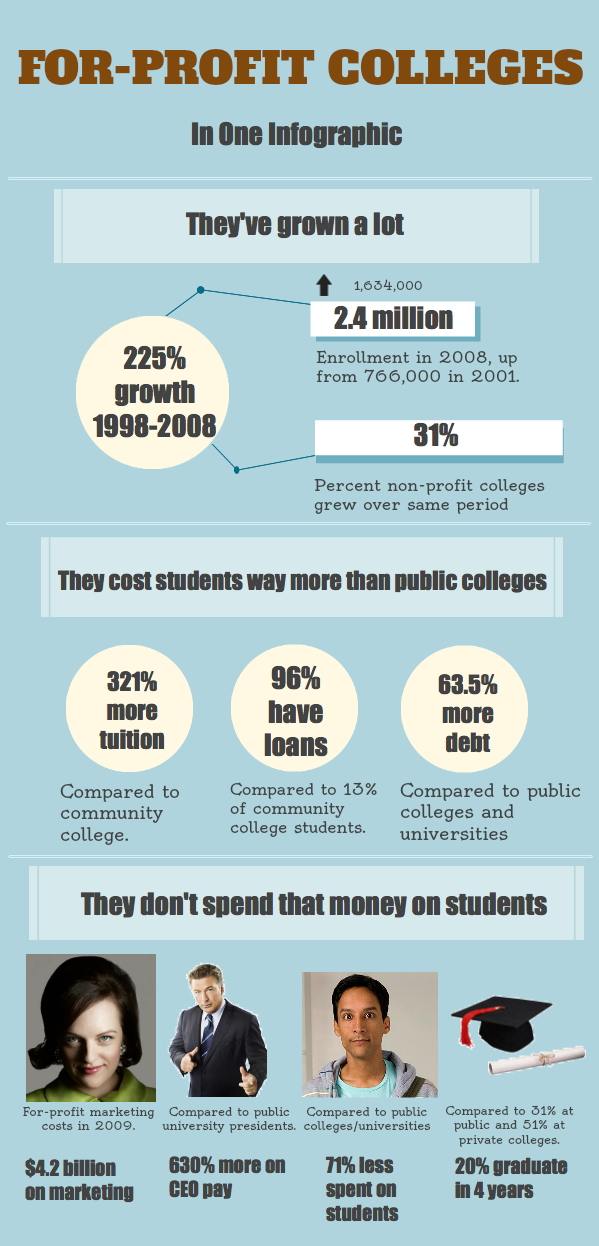
Here’s an infographic we saw over at the Washington Post derived from Senator Harkin’s report summed up by ProPublica that gets right to the heart of the matter in three simple acts: For-profits are a massive business, they cost students more, and conclude with a summary of the money trail.
2 Comments
Rachel
Greetings,
It would be great to update the numbers since 2009. A lot has changed in 3 years. It’s also worth mentioning that community colleges and public colleges/universities are taxpayer-subsidized. For-profits are not, so of course tuition costs more. This also leaves out the fact that for-profits tend to educate adults and the demographics are completely different from “traditional” schools that educate mostly 18-22 year olds. You have to compare apples to apples, and this graphic does not do that. For-profits do a better job than community colleges at graduating adult learners.
Leave a Reply
Campus Buzz
We welcome Tips & Pitches
Latest WA Original Features
-
“Instreamia” Shakes Loose Moss By Launching Spanish Language Mini-MOOC
-
Jörn Loviscach: A German Math Teaching Sensation Emerges On YouTube & Udacity
-
Open University Enters Battle Of The MOOCs, Launches “FutureLearn”
-
Alvaro Salas As A Case Study In Crowd-Funding An Ivy-League Education
-
Jonathan Mugan: How To Build A Free Computer Within A Computer For Your Child
Paul Glader, Managing Editor
@paulglader
Eleni Glader, Policy Editor
Elbert Chu, Innovation Editor
@elbertchu
Biagio Arobba, Web Developer
@barobba
Contributors:
Michael B. Horn
@michaelbhorn
Derek Reed
@derekreed
Annie Murphy Paul
@AnnieMurphyPaul
Frank Catalano
@FrankCatalano
Ryan Craig
@UniVenturesFund
Jonathan Mugan
@JMugan
Terry Heick
@TeachThought
Alison Anderson
@tedrosececi
Ravi Kumar
@ravinepal

The Pulitzer Prize winning investigation newsroom digs into for-profit education.
-
Most Viewed
- Inside Ashford University: A former staffer talks to WiredAcademic
- Infographic: A History Of Information Organization From Stone-Age To Google
- Davos: 12-Year-Old Pakistani Prodigy Girl Talks About Her Online Learning
- Open University Enters Battle Of The MOOCs, Launches "FutureLearn"
- Pearson Llc + Google Expands LMS Business With "OpenClass" System
-
MARKET INTRADAY SNAPSHOT
- Education & Tech Companies We Follow
| APEI | 40.20 |  -0.17 -0.17 |  -0.42% -0.42% | ||
| APOL | 19.01 |  +0.33 +0.33 |  +1.77% +1.77% | ||
| AAPL | 460.16 |  -6.43 -6.43 |  -1.38% -1.38% | ||
| BPI | 10.74 |  -0.09 -0.09 |  -0.83% -0.83% | ||
| CAST | 0.11 |  +0.01 +0.01 |  +10.00% +10.00% | ||
| CECO | 4.08 |  -0.02 -0.02 |  -0.49% -0.49% | ||
| COCO | 2.40 |  -0.02 -0.02 |  -0.83% -0.83% | ||
| CPLA | 32.03 |  -0.41 -0.41 |  -1.26% -1.26% | ||
| DV | 30.69 |  +0.36 +0.36 |  +1.19% +1.19% | ||
| EDMC | 4.03 |  +0.07 +0.07 |  +1.77% +1.77% | ||
| ESI | 18.34 |  +0.04 +0.04 |  +0.22% +0.22% | ||
| GOOG | 792.89 |  +5.07 +5.07 |  +0.64% +0.64% | ||
| LINC | 6.20 |  +0.06 +0.06 |  +0.98% +0.98% | ||
| LOPE | 25.03 |  +0.36 +0.36 |  +1.46% +1.46% | ||
| PEDH | 0.45 |  0.00 0.00 |  +0.00% +0.00% | ||
| PSO | 18.51 |  -0.27 -0.27 |  -1.44% -1.44% | ||
| SABA | 8.61 |  -0.16 -0.16 |  -1.82% -1.82% | ||
| SCHL | 30.87 |  +0.46 +0.46 |  +1.51% +1.51% | ||
| STRA | 51.95 |  -1.54 -1.54 |  -2.88% -2.88% | ||
| WPO | 414.41 |  +5.35 +5.35 |  +1.31% +1.31% |
Domestic, For-Profit, Gainful Employment, Infographics, Personalized Learning, Private, Public, Required, Universities & Colleges - Jan 31, 2013 6:09 - 0 Comments
Infographic: To Get A Degree Or Not To Get A Degree? Here Is An Answer
More In For-Profit
- Ryan Craig: American Clampdown Forcing Forlorn For-Profit Colleges To Look Abroad
- How For-Profit Colleges Major In Marketing & Fail Education
- Infographic: A Graphical Profile Of Today’s Online College Student
- Infographic: A Comparison Of For-Profits v. Non-Profit Online College Data
- Opinion: How “Shareholder Value” Is Destroying For-Profit, Career Colleges
Cost of Education Domestic Education Quality Ethics For-Profit Friend, Fraud, or Fishy Gainful Employment Graduation Rates Legislation Minorities Opinion Recruitment Regulatory Required Retention Rates Student Loans Universities & Colleges
MOOCs, Required, Technology - Feb 16, 2013 10:04 - 0 Comments
MOOC Monitor: Must Reads This Week
More In Technology
- Infographic: Rise of the MOOCs
- Smart Cities Part II: Why DC Is The Planetary Hub Of Online Learning
- Five Questions: Polling EdTech Startup UnderstoodIt’s Liam Kaufman
- Infographic: The Future of Higher Education
- Anne Collier: Study Shows eBooks Gaining Larger Share & Boosting Overall Reading Habits
Domestic K-12 Parents Reading / Literature Required Technology
Charter, Cost of Education, Domestic, Education Quality, Friend, Fraud, or Fishy, K-12, Minorities, Regulatory, Required - Feb 7, 2013 12:23 - 0 Comments
Should For-Profit Companies Manage K-12 Schools? A Skeptical Review
More In Friend, Fraud, or Fishy
- A Letter To Sen. Tom Harkin About For-Profit Charter Schools
- Ryan Craig: American Clampdown Forcing Forlorn For-Profit Colleges To Look Abroad
- Opinion: The Problem With Deceptive Degree Aggregators In The Search For Online Courses & Degrees
- How For-Profit Colleges Major In Marketing & Fail Education
- Infographic: A Comparison Of For-Profits v. Non-Profit Online College Data
Cost of Education Domestic For-Profit Friend, Fraud, or Fishy Graduation Rates Infographics Recruitment Required Universities & Colleges


[...] on http://www.wiredacademic.com Share this:TwitterFacebookPinterestLinkedInTumblrStumbleUponDiggRedditEmailPrintLike this:LikeBe [...]